Data plays a crucial role in different walks of life. Behind every effective decision in life, there is data, which is processed into information then analysed to turn into meaningful insights. For business, these insights can make decision-making much more effective.
To go one step farther, data insights could be very useful in making your testing experience more effective and meaningful by suggesting improvements that could streamline your processes.
Visualization Makes Data Easy to Perceive.
Understanding and analysing the data metrics that result in correct insights is key. Moreover, since software development involves close coordination of different teams working together, it becomes essential for everyone to understand the metrics to collaborate.
Thus, the data insights should be well-received at different levels within the teams working on the project, so that it is well understood and can be leveraged for optimum benefits. Sharing insights within various teams so that they can pitch in ideas as per their expertise helps in improving overall performance.
One of the most efficient ways to gather information is through Visualization.
Did you know that 65% of the population are Visual Learners?
Visual Learners grasp information more easily and retain it longer when learned through visual stimulation, such as images, color-codes, spatial relations, charts, and graphs.
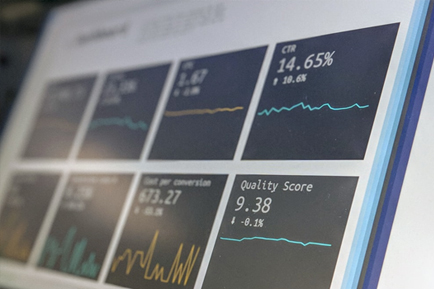
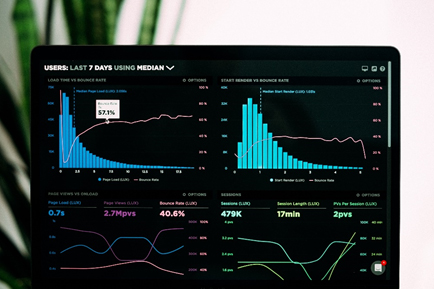
Utilizing visualization of your testing metrics helps in processing the data into those meaningful insights to help ensure your testing procedures are headed in the right direction. These visualizations can be studied easily to gauge the trends and the impacts of your testing strategies.

5 Benefits of Visualization for an Enhanced Testing Experience
In addition to the distinct and precise representation of important data metrics, Visualization offers these key advantages that improve the overall Testing Experience:
1. It Saves Time in Data Processing
The human retina is capable of transmitting data at the speed of 10 million bits per second, which means a lot of data can be processed by the human brain in a very short span of time.
Since the data that would be represented in the form of visuals, like graphs and charts, are already comprehensive—and already contain a large amount of data in a single visual—using data visualization in your testing can make processing faster.
This is beneficial especially when one must process it for making a performance related decision. Visualization supports quick and precise decision making.
2. It Shows Insights That Might be Missed in Traditional Reports
Visualization offers a multi-dimensional approach to depicting data, highlighting different aspects and patterns, which could be missed while analysing traditional reports. When text-formatted reports make side-by-side comparisons difficult—especially when multiple parameters are involved—visualization of data comes in handy.
3. It Helps in Identifying Trends
Charts and graphs are the best ways to identify trends and patterns of data metrics. This helps in identifying gaps, which could be beneficial in troubleshooting and tracing root-causes of possible issues.
4. It Makes Communication of Insights Legible
The interactive elements of data metrics visualized in the form of graphs and charts, makes the communication clear. In Test Automation, where different teams are involved, sharing insights become easier, as visualization enriches the communication. The advantage is teams can collaborate much more quickly, effectively, and easily.
5. Uncover Trends and No-Risk Possibilities
Visualization allows the user to interact with the data by entering estimated information and seeing potential trends. This helps in uncovering various possibilities, as one can put the estimated values of certain parameters and check out its impact on other parameters as well as the overall performance.
Through these possible impacts and outcomes, one can decide the future course of action, without putting the actual operations at risk. This approach is beneficial more particularly in cases where innovation is required to get out of the box results.
Visualization Helps in Monitoring KPIs for a Better Testing Experience
Through metrics visualization, comparing Key Performance Indices (KPIs) becomes a great deal easier. After every change implemented in the testing process, one could easily compare the KPIs to understand its effectiveness in different aspects. This helps in overhauling and optimizing the testing process so that it meets set industry standards, saving both time and resources, thereby helping businesses improve their ROI from the investment made in Test Automation.
These KPIs will improve your testing experience as there is minimal effort to understand the test analytics, and evaluating its performance becomes hassle-free.

Visualization and Machine Learning: Powerful Together
Data visualization and Machine Learning are great technologies individually but when combined, the result is remarkable. Although Machine Learning helps in constantly improving the performance by taking continuous inputs and using them to adapt dynamically, visualization of metrics makes the process more efficient.
Since visualization already segregates the data and represents it in a comprehensive visual format, taking inputs becomes quick and precise for Machine Learning via algorithms.
Integration of Machine Learning and data visualization can be leveraged to evaluate your ROI of your test automation practices, and improve it through analysis of key metrics, enhancing the Testing Experience for your business.
The Way Ahead
For delivering a high-end quality of the software product/service, tracking ROI from the test automation system of your business is the need of the hour. This will not only result in customer delight through a rich user experience and high-quality software but will also help your business in managing costs for better profitability.
Finding the right testing suite that could help you deliver the advanced features efficiently within the short timeframe of every release-cycle is extremely important. This can be efficiently done by leveraging the power of advanced technologies like AI, Machine Learning, and data visualization.
Using modern technology coupled with having the right tech partner will help you streamline your technical operations. A tech partner that offers an interdisciplinary approach and a strong technical background will help you, not only locate the issues within your existing test automation system but will overhaul them for the best results.
UReport (Unified Report Platform) by BrickRed Systems is one such solution that offers the in-depth monitoring and multi-dimensional evaluation of your test automation system using Artificial Intelligence. It offers a one-stop comprehensive platform that is compatible with all test frameworks while making the best use of important information through advanced algorithms.
As a result, comprehensive and detailed insights are available for your business management team that can be used for improving their product delivery. This will help them make well-informed decisions related to the test automation of a product while delivering excellence to the end-user, without going overbudget.
Try advanced data visualization-powered reports to track the vital metrics of your existing test automation suite. You will not be disappointed!
